Insider Censoring in Environmental Data: Why It Biases Results and How to Fix It
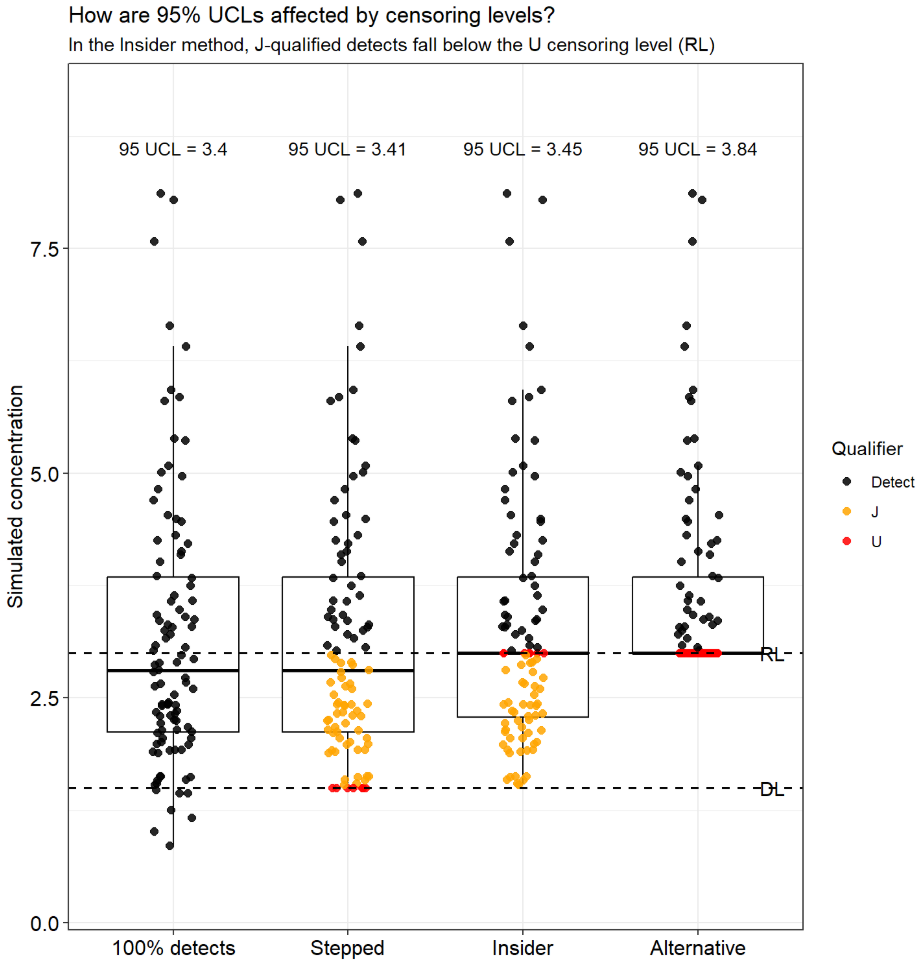
Measurements near analytical detection and reporting limits are common in environmental datasets, and how these values are reported can materially influence statistical results. Insider censoring occurs when nondetect observations are censored at the reporting limit while detected values remain below that threshold. This practice introduces informative censoring that distorts distributional shape, biases summary statistics, and can alter conclusions drawn from environmental analyses. This post examines insider censoring, explains why it introduces bias in environmental datasets, and discusses approaches for mitigating its effects.