Blog

Data analytics, statistics, and more

Multiple Linear Regression with Shrinkage

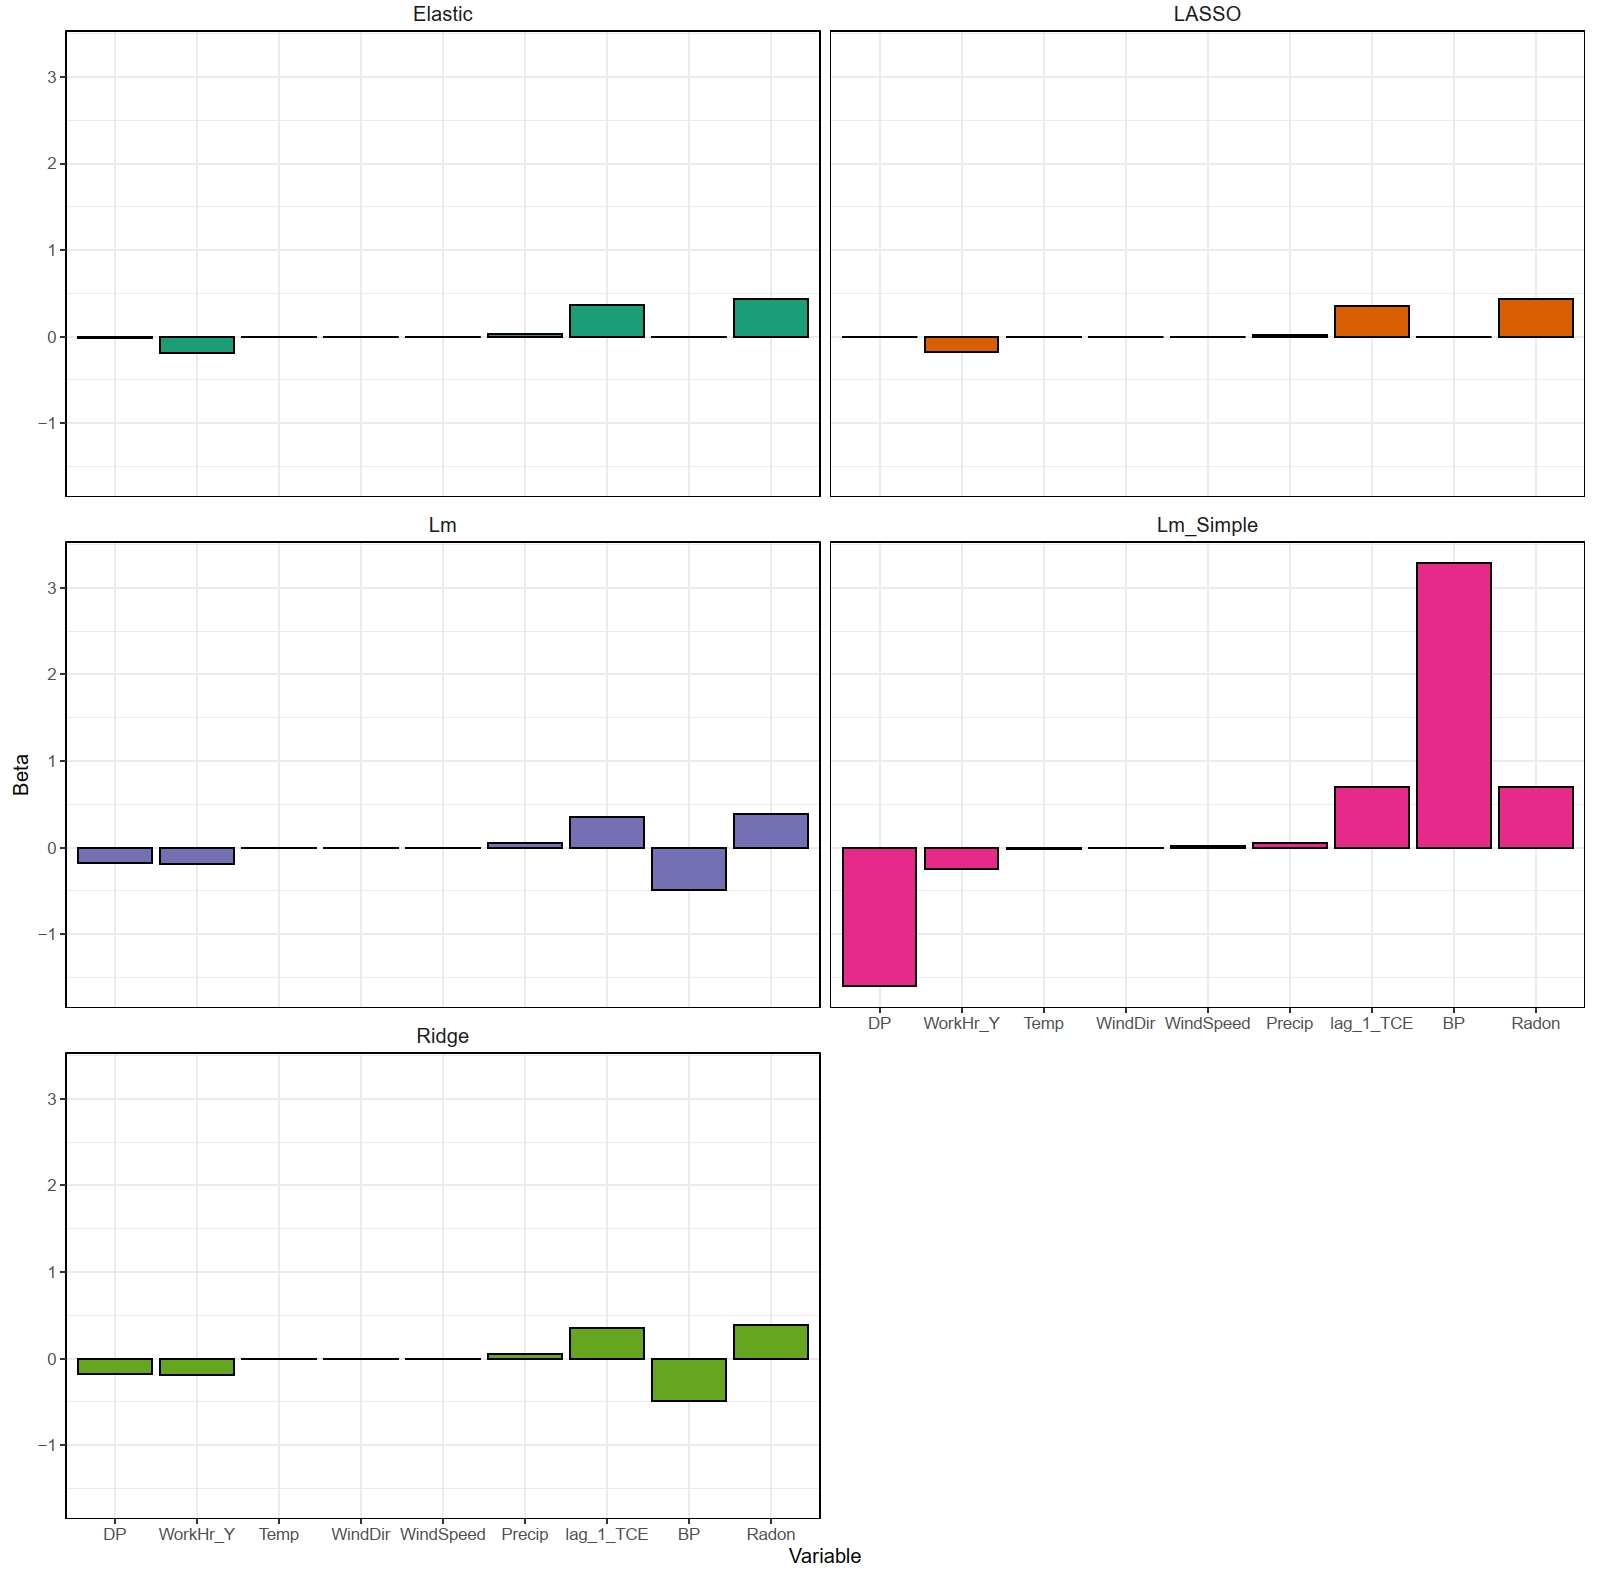
This post compares simple linear regression and multiple linear regression with and without shrinkage using an indoor air dataset consisting of trichloroethene concentrations and various explanatory variables, including radon concentration, temperature, barometric pressure, wind direction, and wind speed

April 28, 2020

Linear Regression with Categorical Variables

This post explores linear regression with one-hot encoding. For those datasets with many categorical variables and where the categorical variables in turn have many unique levels, the number of features can quickly escalate. In these cases, label/ordinal encoding or some other alternative should be explored.

April 5, 2020

Exploring the COVID-19 Pandemic by Country

With the rapid spread in the novel coronavirus across countries, the World Health Organisation and several countries have published latest results on the impact of COVID-19 over the past few months. The objective of this post is to demonstrate how visualization using the R programmin language helps to derive informative insights from data sources.

March 18, 2020

Analyzing COVID-19 Outbreak in China

This is a perfunctory exploration of the early transmission dynamics of coronavirus disease 2019 (COVID-19) in mainland China. The basic reproduction number and the per day infection mortality and recovery rates are estimated using a classic SIR compartmental model of communicable disease outbreaks.

March 15, 2020

Feature Selection Methods for Machine Learning

Feature Selection is a core concept in machine (statistical) learning that can have significant impacts on model performance. This post examines various methods to identify the most important predictor variables in machine learning that explain the variance of the response variable.

February 14, 2020

Creating Static Maps Using R

Use the functionality of R and R packages to create both simple maps and complex maps containing many different layers.

September 18, 2019

Testing Group Differences with Data Containing Non-detects

Often data from more than two groups needs to be evaluated, usually on the basis of a representative value from each group. This post examines the use of survival analysis techniques to test whether surface water samples containing a high frequency of censored (non-detect) values differ in dissolved lead concentration between various watersheds.

September 13, 2019

Outlier Detection Using Machine Learning

There is no precise way to define and identify outliers in general because of the specifics of each dataset. This post evaluates three methods for multivariate outlier detection, including Mahalanobis distance (a multivariate extension to standard univariate tests) and two machine learning (clustering) techniques.

September 9, 2019

Introduction to Statistical Intervals

The issue of uncertainty in estimating population parameters from data samples is often addressed using statistical intervals. The three types of statistical interval differ in their definitions as well as their typical applications. It is important to fully understand the assumptions and limitations underlying the use, interpretation, and calculation of statistical intervals before applying them.

August 6, 2019

Power of the Mann-Kendall Test

An important objective of many environmental monitoring programs is to detect changes or trends in constituent concentrations over time. The Mann-Kendell test is one of the most popular nonparametric tests for determining temporal trend. This post evaluates the power of the Mann-Kendall test to identify a trend for various sample sizes and variability in the data using Monte Carlo simulation.

July 21, 2019