Introduction to Statistical Intervals
By Charles Holbert
August 6, 2019
Introduction
Uncertainty arises in the estimation of the true or population values of data statistics (e.g., mean, standard deviation, and percentiles) because a relatively small data sample is typically used to obtain an estimate of the statistic, which is presumed to apply to the entire data population. The issue of uncertainty in estimating population parameters from data samples is often addressed using statistical intervals. Statistical intervals provide a way to quantify the uncertainty about a scalar quantity of a population based on a random sample of data. A statistical interval is a range, comprising a lower bound and an upper bound, which is expected to contain the true population value, with a certain degree of confidence. Because statistical intervals are based upon limited sample data that are subject to random sampling variation, they sometimes will not contain the parameter they were calculated to contain, even when all necessary assumptions hold. Instead, they are correct only a specified percentage (e.g., 90%, 95%, or 99%) of the time, meaning, they are correct with a specified “degree of confidence.”
Types of Statistical Intervals
The three types of statistical interval commonly used are confidence intervals, tolerance intervals, and prediction intervals. These three intervals differ in their definitions as well as their typical applications.
Confidence Interval. A confidence interval gives a range within which a population parameter such as the mean or standard deviation of the population is expected to fall. For instance, a 95% confidence interval means that if the same population is sampled on numerous occasions and interval estimates are made on each occasion, the resulting intervals would bracket the true population parameter in approximately 95% of the cases. In other words, there is a 95% chance of selecting a sample such that the 95% confidence interval calculated from that sample contains the true population mean.
Tolerance Interval. A tolerance interval consists of an interval expected to contain a prespecified proportion of the underlying data population, with a specified level of confidence. As an example, a 95% tolerance interval with a 95% confidence level, contains, on average, 95% of the data population with a 95% confidence level. The tolerance interval is said to have 95% coverage (i.e., coverage or tolerance coefficient of 0.95) and a confidence level of 95%.
Prediction Interval. A prediction interval differs from confidence and tolerance intervals in that while the other two intervals are associated with existing (i.e., current) data, a prediction interval is constructed from existing data and consists of an upper and lower bound expected to contain the next future randomly selected value(s) from the underlying data population, with a specified level of confidence. For instance, a 95% prediction interval specifies the upper and lower bounds of an interval for which there is 95% confidence that a future data value, or a number of future data values, from the same data population will fall within.
A statistical interval is two-sided when it has both a lower and an upper bound. For a 95% confidence interval for instance, there is a 95% chance that the interval contains the population parameter of interest and a 5% chance that it falls outside the interval. Of the 5% chance that the interval does not contain the parameter, 2.5% (i.e., half of 5%) is the chance that the true parameter value is greater than the upper bound of the interval (i.e., the upper confidence limit [UCL]), and the remaining 2.5% is the chance that the true parameter value is below the lower bound of the interval, that is, the lower confidence limit (LCL), assuming the underlying data population is symmetrically distributed (such as the normal distribution). An interval is one-sided when there is only one limit. For a 95% UCL for instance, there is a 95% chance that the true or population parameter value falls below the confidence limit and a 5% chance that the population parameter is greater than the limit. Conversely, for a one-sided 95% LCL, there is a 95% chance that the population parameter value is larger than the confidence limit and a 5% chance that it is smaller than the limit.
Statistical intervals can generally be classified as parametric intervals or nonparametric intervals. As with most other statistical procedures, parametric intervals require that the data or a suitable transformation of the data conform to a known distribution. Nonparametric intervals are “distribution-free” (i.e., do not require the data to belong to any particular distribution). Some intervals, notably confidence intervals to include the population mean, are relatively insensitive to the assumed distribution; other intervals strongly depend on this distribution (Meeker et al., 2017).
Estimating Intervals
Let’s estimate statistical intervals on a univariate data set composed of 40 barium samples with a mean value of 139 milligrams per kilogram (mg/kg) and a standard deviation of 14.75 mg/kg.
set.seed(123)
x <- rnorm(40, mean = 139, sd = 14.75)
dd <- data.frame(barium = x)
summary(dd)
barium
Min. :110.0
1st Qu.:130.8
Median :140.3
Mean :139.7
3rd Qu.:149.2
Max. :165.4
Although we don’t need a linear regression, the lm() function in the R statistical language makes it easy to construct statistical intervals. We can estimate the mean by fitting a regression model with an intercept only (no slope) and using a default confidence level of 95%. We will assume a coverage of 95% for the tolerance interval.
Each of the statistical intervals has a length of 40, but because there is no slope in the “model”, each row is the same.
# Get intervals
CI <- predict(lm(dd$barium ~ 1), interval = "confidence")
PI <- predict(lm(dd$barium ~ 1), interval = "predict")
TI <- tolerance::regtol.int(
  reg = lm(dd$barium ~ 1), new.x = NULL,
  side = 2, alpha = 0.05, P = 0.95
)
Now, let’s visualize the intervals.
# Create plot
library(ggplot2)

limits_CI <- aes(x = 1.3, ymin = CI[1, 2], ymax = CI[1, 3])
limits_PI <- aes(x = 0.7, ymin = PI[1, 2], ymax = PI[1, 3])
limits_TI <- aes(x = 0.4, ymin = TI[1, 5], ymax = TI[1, 6])

p <- ggplot(dd, aes(x = 1, y = barium)) +
  geom_jitter(width = 0.1, height = 0, pch = 21, size = 4, fill = "#059DD4",
              color = "black", alpha = 0.5) +
  geom_errorbar(limits_TI, width = 0.1, size = 1, color = "#BC580B") +
  geom_point(aes(x = 0.4, y = TI[1, 4]), size = 3, color = "#BC580B") +
  geom_errorbar(limits_PI, width = 0.1, size = 1, color = "#1A425C") +
  geom_point(aes(x = 0.7, y = PI[1, 1]), size = 3, color = "#1A425C") +
  geom_errorbar(limits_CI, width = 0.1, size = 1, color = "#629B17") +
  geom_point(aes(x = 1.3, y = CI[1, 1]), size = 3, color = "#629B17") +
  scale_x_continuous(limits = c(0.2, 1.7)) +
  scale_y_continuous(limits = c(100, 180),
                     expand = c(0, 0)) +
  labs(title = NULL,
       x = NULL,
       y = "Concentration (mg/L)") +
  theme_minimal() +
  theme(aspect.ratio = 1.5) +
  theme(axis.title.y = element_text(size = 14, color = 'black',
                                    face = quote(bold)),
        axis.text.y = element_text(size = 12, color = 'black'),
        axis.line.y.left = element_line(color = 'black'),
        plot.margin = unit(c(0.1, 0.1, 0.1, 0.1), 'in'),
        legend.position = "none",
        panel.grid.major = element_blank(),
        panel.grid.minor = element_blank(),
        axis.text.x = element_blank(),
        axis.ticks.x = element_blank()) +
  geom_text(aes(x = 0.34, y = 140, label = "95% / 95% Tolerance Interval",
            hjust = 0.5, cex = 2), angle = 90, col = "#BC580B") +
  geom_text(aes(x = 0.64, y = 140, label = "95% Prediction Interval",
            hjust = 0.5, cex = 2), angle = 90, col = "#1A425C") +
  geom_text(aes(x = 1.5, y = 140, label = "95%\nConfidence\nInterval",
            hjust = 0.5, cex = 2), col = "#629B17")
p
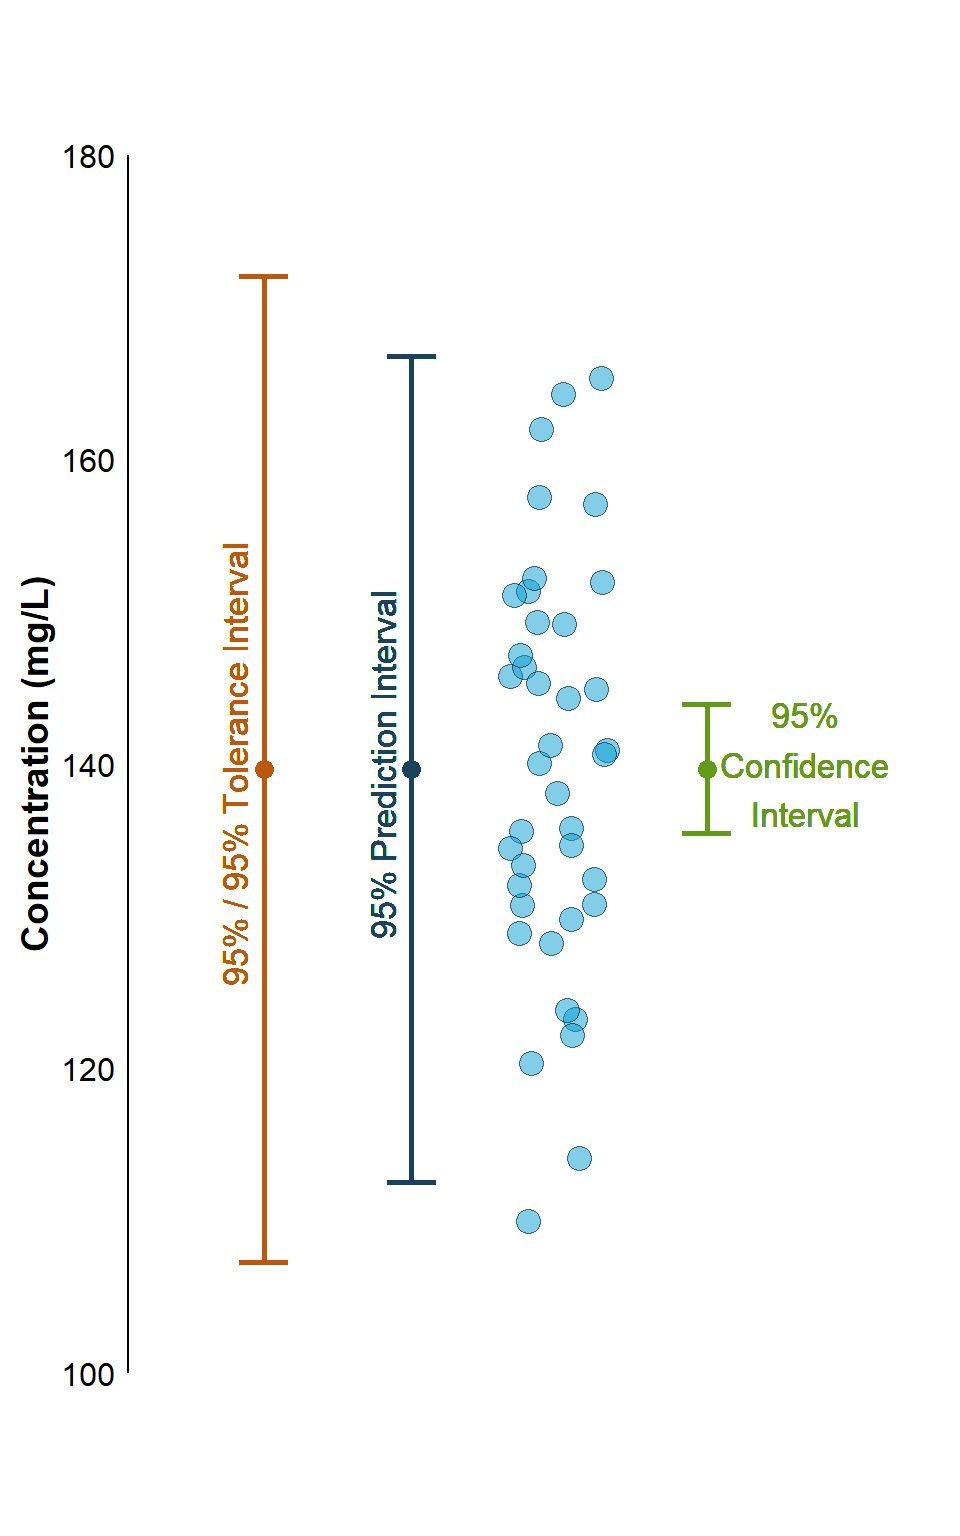
This illustrates the large differences in interval width between the various interval types. For a given sample size and confidence level, a confidence interval for the mean is always narrower than a prediction interval to contain all m future observation or a tolerance interval to contain a proportion of the distribution. Whether a prediction interval is narrower than a tolerance interval depends on the number of future observations to be contained in the prediction interval and the proportion of the distribution to be contained in the tolerance interval.
Intervals Based on Linear Regression
Thus far, we have illustrated statistical intervals for a standard univariate distribution. Now, let’s consider statistical intervals for linear regression. Let’s fit a linear regression model showing the relationship in 1935 of the average prices of common stock on the New York Stock Exchange to earnings per share for 12 chemical manufacturers (from Brumbaugh and Kellogg 1941, Table 148, p. 710).
# Read data in comma-delimited file
dat <- read.csv('data/stock_data.csv', header = T)

# Linear regression
linfit <- lm(Price ~ Earnings, data = dat)
summary(linfit)
##
## Call:
## lm(formula = Price ~ Earnings, data = dat)
##
## Residuals:
##     Min      1Q  Median      3Q     Max
## -18.335  -8.103  -1.966   6.444  25.689
##
## Coefficients:
##             Estimate Std. Error t value Pr(>|t|)
## (Intercept)   11.624      9.845   1.181    0.265
## Earnings      16.623      2.009   8.274 8.75e-06 ***
## ---
## Signif. codes:  0 '***' 0.001 '**' 0.01 '*' 0.05 '.' 0.1 ' ' 1
##
## Residual standard error: 14.59 on 10 degrees of freedom
## Multiple R-squared:  0.8726,	Adjusted R-squared:  0.8598
## F-statistic: 68.47 on 1 and 10 DF,  p-value: 8.752e-06
Let’s perform a global test to assess the linear model assumptions, as well as perform directional tests designed to detect skewness, kurtosis, a nonlinear link function, and heteroscedasticity.
library(gvlma)
gvmodel <- gvlma(linfit)
summary(gvmodel)
##
## Call:
## lm(formula = Price ~ Earnings, data = dat)
##
## Residuals:
##     Min      1Q  Median      3Q     Max
## -18.335  -8.103  -1.966   6.444  25.689
##
## Coefficients:
##             Estimate Std. Error t value Pr(>|t|)
## (Intercept)   11.624      9.845   1.181    0.265
## Earnings      16.623      2.009   8.274 8.75e-06 ***
## ---
## Signif. codes:  0 '***' 0.001 '**' 0.01 '*' 0.05 '.' 0.1 ' ' 1
##
## Residual standard error: 14.59 on 10 degrees of freedom
## Multiple R-squared:  0.8726,	Adjusted R-squared:  0.8598
## F-statistic: 68.47 on 1 and 10 DF,  p-value: 8.752e-06
##
##
## ASSESSMENT OF THE LINEAR MODEL ASSUMPTIONS
## USING THE GLOBAL TEST ON 4 DEGREES-OF-FREEDOM:
## Level of Significance =  0.05
##
## Call:
##  gvlma(x = linfit)
##
##                     Value p-value                Decision
## Global Stat        2.8963  0.5753 Assumptions acceptable.
## Skewness           0.6834  0.4084 Assumptions acceptable.
## Kurtosis           0.2586  0.6111 Assumptions acceptable.
## Link Function      0.9235  0.3366 Assumptions acceptable.
## Heteroscedasticity 1.0308  0.3100 Assumptions acceptable.
Now that we have verified the model assumptions, let’s compute the 95% confidence interval, the 95% prediction interval, and the 95%/95% tolerance interval. After computing the various intervals, let’s visualize the results.
library(Hmisc)    # for minor ticks on the plot
library(tolerance)

# New data for predictions
newx <- seq(min(dat$Earnings), max(dat$Earnings), by = 0.2)
newdat <- data.frame(Earnings = newx)

# Confidence intervals
conf_interval <- predict(
  linfit, newdata = newdat,
  interval = "confidence",
  level = 0.95
)

# Prediction intervals
pred_interval <- predict(
  linfit, newdata = newdat,
  interval = "prediction",
  level = 0.95
)

# Tolerance intervals
tol_interval <- regtol.int(
  reg = linfit,
  new.x = newdat,
  side = 2, alpha = 0.05, P = 0.95
)

# Create plot
Y <- seq(0, 200, 50)
X <- seq(0, 10, 2)

with(dat,
  plot(
    Earnings, Price,
    pch = 16, cex = 1.2, col = '#059DD4',
    axes = FALSE,
    ylim = c(0, 200), xlim = c(0, 10),
    font.lab = 2, cex.lab = 1.2, cex.main = 1.2,
    main = 'Regression Example',
    xlab = 'Earnings', ylab = 'Price'
  )
)

mtext("Common Stock and Earnings per Share", side = 3, line = 0.5, font = 4)
box()
axis(1, X, labels = prettyNum(X, big.mark = ","))
axis(2, Y, labels = prettyNum(Y, big.mark = ","))
minor.tick(nx = 10, ny = 5)
lines(newx, pred_interval[,1], col = "black", lty = 1, lwd = 2)
lines(newx, conf_interval[,2], col = "#083AAF", lty = 3, lwd = 2)
lines(newx, conf_interval[,3], col = "#083AAF", lty = 3, lwd = 2)
lines(newx, pred_interval[,2], col = "#083AAF", lty = 2, lwd = 2)
lines(newx, pred_interval[,3], col = "#083AAF", lty = 2, lwd = 2)
lines(newx, tol_interval[is.na(tol_interval$y), 5], col = "red", lty = 1, lwd = 2)
lines(newx, tol_interval[is.na(tol_interval$y), 6], col = "red", lty = 1, lwd = 2)

legend(
  "topleft",
  legend = c(
    "Linear Regression",
    "95% Confidence Interval",
    "95% Predicition Interval",
    "95% / 95% Tolerance Interval"
  ),
  lwd = 3 * par("cex"),
  col = c("black", "#083AAF", "#083AAF", "red"),
  lty = c(1, 3, 2, 1),
  text.font = 1, bty = "n",
  pt.cex = 1, cex = 0.8, y.intersp = 1.3
)
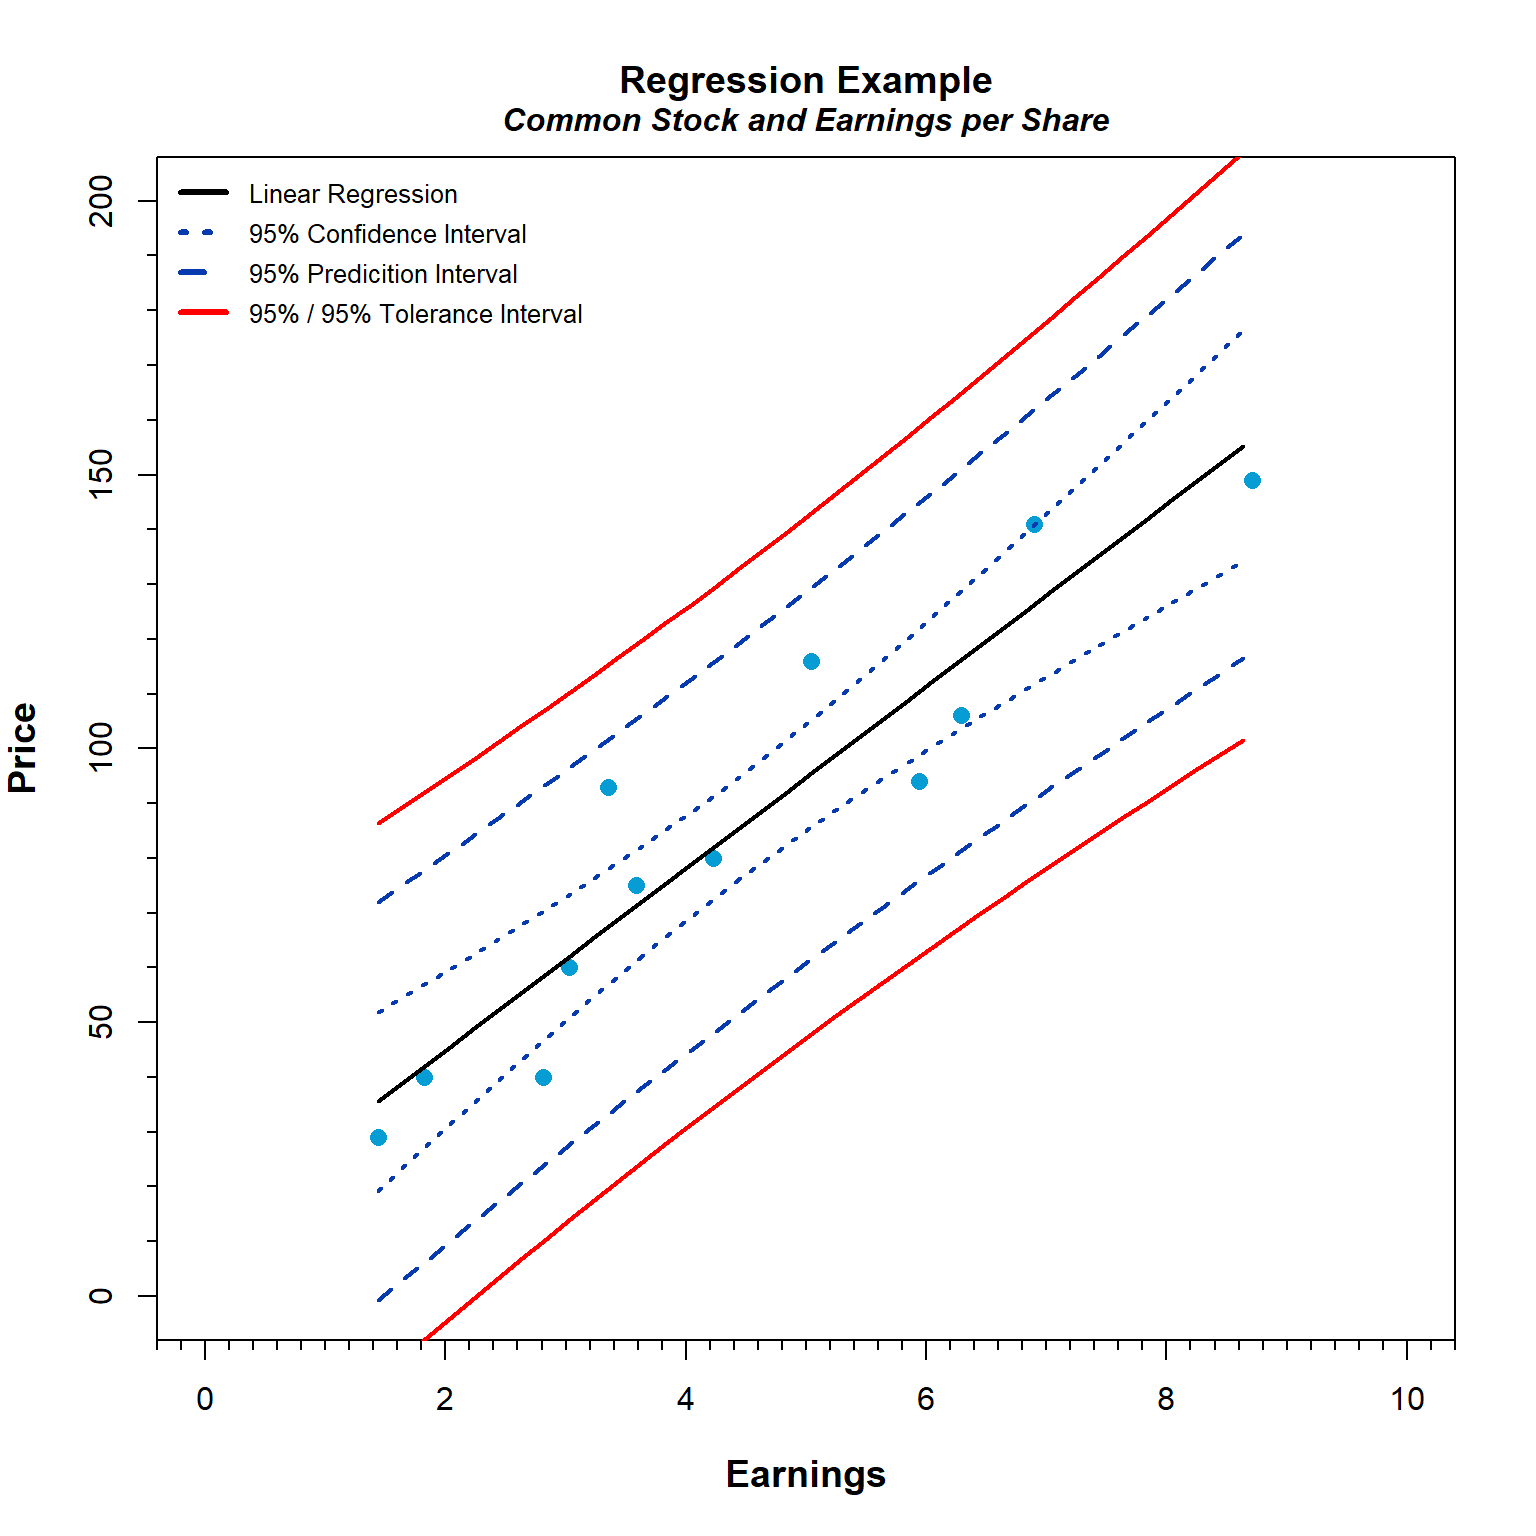
Like the univariate example, the width of the 95% confidence interval is small compared to the widths of the other intervals. Note that the prediction interval provides an interval where the next sample result is expected to fall. If one more sample is collected many times, its value is “expected” to be within the interval in 95% of the samples. There is a 50% chance that the value of the next sample is within the interval in more than 95% of the samples, and a 50% chance that the value is within the interval in less than 95% of the samples. To ensure a specified percentage of future sample values are contained within the interval with 95% confidence, a tolerance interval should be used.
Conclusions
The appropriate statistical interval for a particular application depends on the needs of the application. One must decide whether the main interest is in describing the population from which the sample has been selected or in predicting the results of a future sample from the same population. For a fixed level of confidence, narrower intervals are expected with larger sample sizes. For example, increasing the sample size by a factor of k will generally reduce the width of the confidence interval by a factor of approximately the square root of k (Meeker et al. 2017). The expected width of prediction intervals and tolerance intervals also becomes narrower with increased sample size. For small sample sizes, the statistical interval is often so wide that it has little practical meaning. A narrower interval can be obtained at the cost of reducing one’s confidence in its correctness by lowering the confidence level. A narrow statistical interval usually implies a small degree of uncertainty, but only if the required assumptions are valid. Because of this, it is important to fully understand the assumptions and limitations underlying the use, interpretation, and calculation of statistical intervals before applying them.
References
Brumbaugh M.A. and L. S. Kellogg. 1941. Business Statistics. Irwin, Chicago.
Meeker, W.Q, G.J. Hahn, and L.A. Escobar. 2017. Statistical Intervals: A Guide for Practitioners and Researchers, Second Edition. Wiley, Hoboken.
- Posted on:
- August 6, 2019
- Length:
- 12 minute read, 2407 words
- See Also: